September 27, 2026
Looking for AI in Linux kernel growth
I expected AI coding tools to leave a visible bend in the curve. Across 113 Linux releases, I could not see one.
My original hypothesis was that AI would be visible in the growth of the Linux kernel. If coding assistants were making it substantially easier to produce code, perhaps the recent part of the growth curve would become conspicuously steeper. Linux has enough history to put that expectation on a graph.
I measured 113 release snapshots, from v2.6.11 in March 2005 through v7.2 in August 2026, and plotted them with every version annotated. The vertical axis is SLOCCount's estimate of the person-years needed to recreate each release's codebase, using the same model parameters throughout. It is a measure derived from code size, not a record of hours worked.
The kernel grew a great deal. I could not see the recent acceleration I had expected.
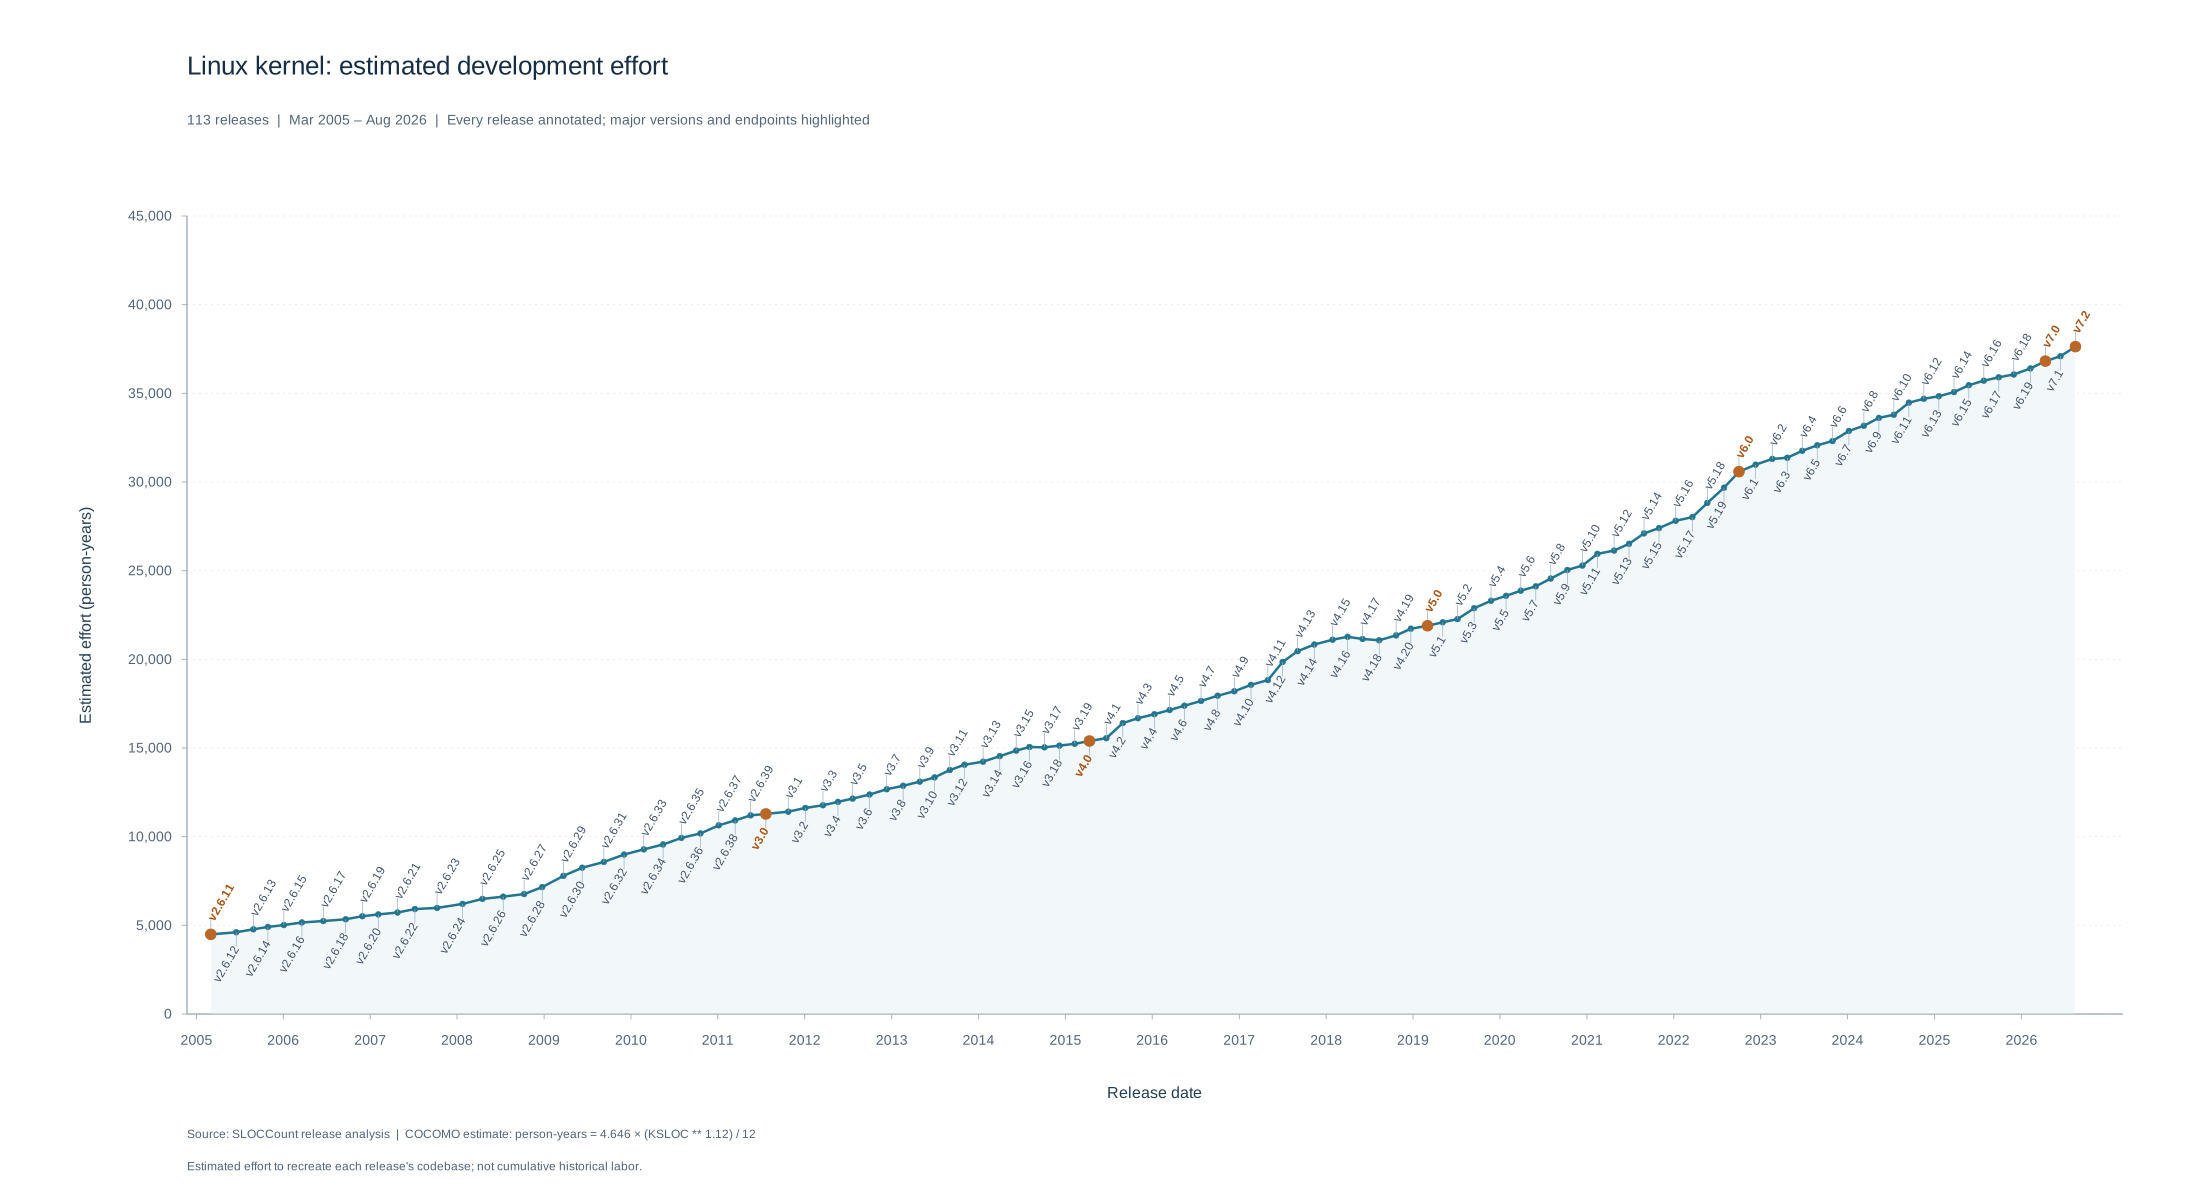
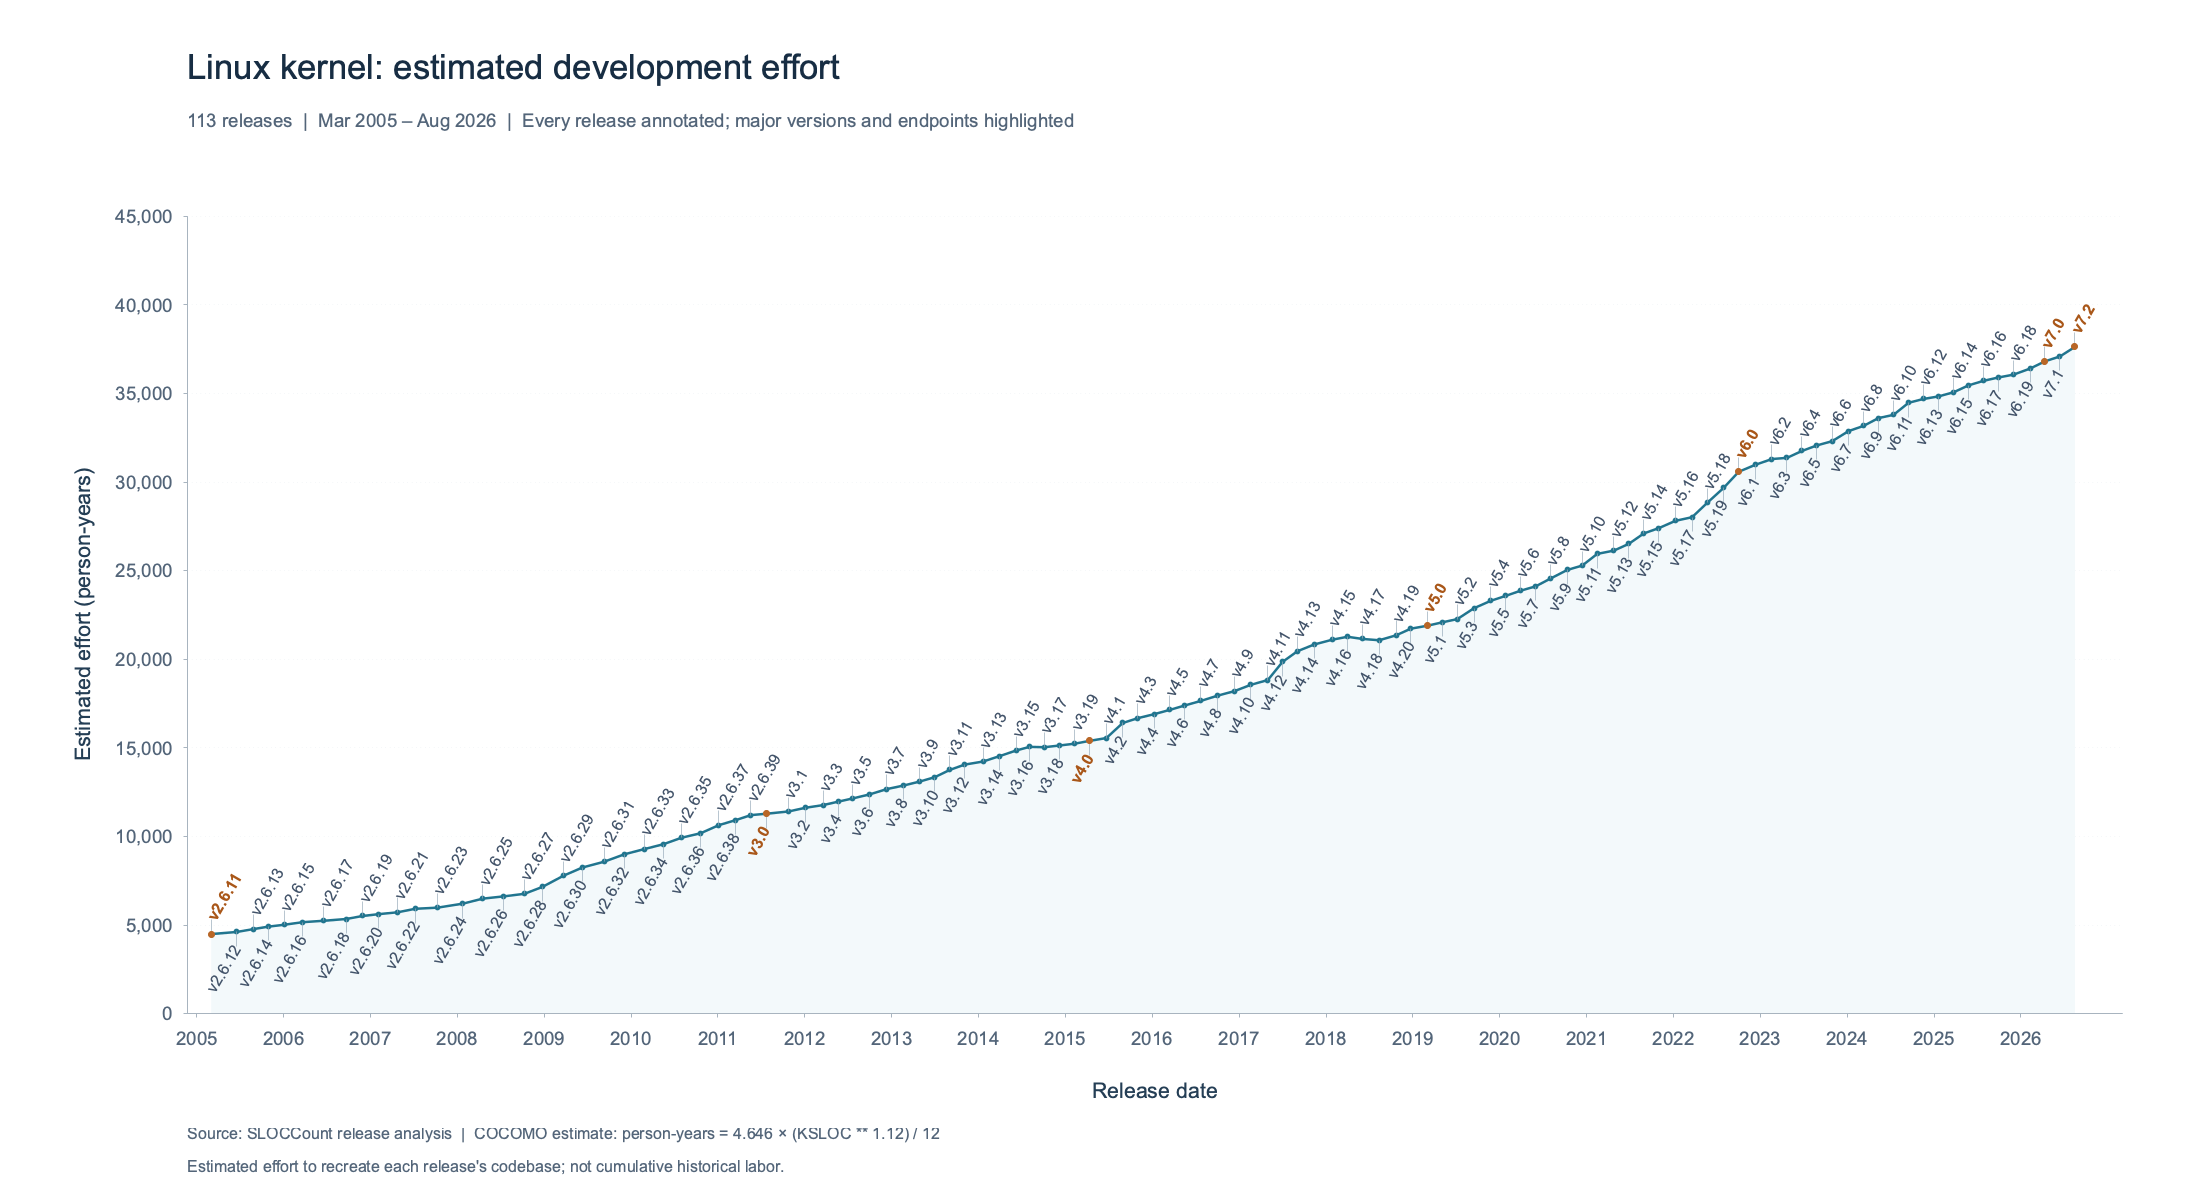
The estimate rises from 4,492.75 person-years for v2.6.11 to 37,633.03 person-years for v7.2, an increase of about 8.38 times. That ratio applies to the effort estimate. The model is nonlinear, so it would be wrong to describe it as an 8.38-fold increase in lines of code.
There are changes in pace along the way. The curve flattens around 2018 and climbs more quickly in other stretches. What I do not see is a distinct, sustained upward break in the most recent years that makes the AI hypothesis jump off the page.
A graph covering two decades can hide changes, so I also compared the average increase over several intervals. I used the last sampled releases of 2018, 2020, 2022, and 2024 as boundaries, then the final observation in August 2026. These are convenient calendar boundaries, not measurements of when kernel developers started using AI.
| Dates in the CSV | Releases | Increase in estimated person-years | Increase per calendar year |
|---|---|---|---|
| 2018-12-23 to 2020-12-13 | v4.20 to v5.10 | 3,562 | 1,804 |
| 2020-12-13 to 2022-12-11 | v5.10 to v6.1 | 5,689 | 2,854 |
| 2022-12-11 to 2024-11-17 | v6.1 to v6.12 | 3,716 | 1,920 |
| 2024-11-17 to 2026-08-16 | v6.12 to v7.2 | 2,940 | 1,685 |
The last column divides the change in the estimate by elapsed days divided by 365.2425. Values are rounded to whole person-years after calculation. These are rates of change in a size-based estimate; they are not measurements of how many engineers worked on the kernel.
Of these intervals, late 2020 through late 2022 has the largest average increase. The two later intervals are slower. That does not establish that AI slowed anything down. It does make it harder to point at this series and claim an obvious recent explosion in code growth. This is a descriptive comparison, not a formal test for a change in trend or a causal estimate of AI's effect.
The measurement deserves some explanation. I used a Python script to enumerate final release tags, extract each tagged source tree, and run David A. Wheeler's SLOCCount. SLOCCount counts source lines while excluding blank lines and comments, with its own language recognition and file-selection rules. Its default rules also filter duplicate files and try to exclude generated code. This is the release source tree as seen by that tool, rather than the code compiled into one particular machine's kernel.
For every release, the script passes --effort 4.646 1.12, giving this COCOMO
effort calculation:
estimated person-years = 4.646 × (KSLOC ** 1.12) / 12
KSLOC means thousands of counted source lines. Holding those parameters fixed
lets me compare releases using one scale. It does not validate the absolute
labor estimate. The coefficient scales the vertical axis, and the exponent
changes its shape. In particular, the model can rise faster as the codebase
gets larger even if the number of lines added each year stays constant.
The dates in the CSV are UTC commit dates, with tag dates as a fallback. The old v2.6.11 tree tag has no usable timestamp, so the script supplies its recorded release date, March 2, 2005. Each row describes the code present at that snapshot. It does not add up all the code ever written and subsequently replaced or deleted.
That distinction is central to interpreting the result. An AI assistant could help someone understand a subsystem, diagnose a bug, write a test, or replace a large implementation with a smaller one. It could help produce the same amount of accepted code in less time. Those changes could be useful without making this curve steeper. With fixed COCOMO parameters, identical counted source sizes produce identical effort estimates, however the code was written.
There could also be limits elsewhere in the process. If review, testing, or integration limits what reaches a release, faster code generation need not translate into faster growth of the released tree. Additions and removals can also offset each other. These are possible explanations for why an effect might be invisible here; the growth curve alone does not distinguish among them.
So the finding I can defend is fairly specific: I found no obvious AI-related acceleration in this release-level measure of Linux kernel growth. This first pass looked at release size. The underlying Git history offers more to investigate: commit frequency, contributor activity, patch sizes, additions and deletions, and the kinds of changes landing in different subsystems. Commit messages may also preserve review credits or explicit disclosures of AI assistance. If those records offer useful evidence, we'll come back and study it.
The CSV, counting script, and gnuplot script are available to inspect or reuse. To redraw the graph, download the CSV and gnuplot script into the same directory and run:
gnuplot plot-linux-effort.gnuplot
To repeat the counts, the Python script accepts --repo /path/to/linux and
--fetch-tags; it requires Git, SLOCCount, Python 3.9 or later, and a Linux or
macOS environment with enough RAM for its temporary source trees. The data was
generated using SLOCCount by David A. Wheeler.
My original hypothesis predicted a visible bend in the curve. The graph did not give me one, and I do not get to draw it in.