September 25, 2026
GoblinStore versus S3 Express, one object at a time
A Dell R820, spinning disks, Graviton4 clients, and a reproducible comparison across the same 590 objects.
Across the same 590 objects, totaling 323.825 GB, GoblinStore delivered 210.5 MB/s uploads and 345.9 MB/s downloads. S3 Express One Zone delivered 124.5 MB/s uploads and 150.0 MB/s downloads. Median read time to first byte was 2.270 ms for GoblinStore and 4.453 ms for S3 Express.
That is 1.69× the upload throughput, 2.31× the download throughput, and 49.0% lower median read TTFB for the GoblinStore configuration I measured. Its server was a Dell PowerEdge R820 backed by spinning disks.
These are measurements of two deployed configurations, with different clients and network paths. They establish what those configurations delivered for this serial workload. A contest over maximum aggregate throughput would be silly: one R820 in my basement is a bug on Amazon's windshield. The first part of this study asks what each configuration delivers one object at a time.
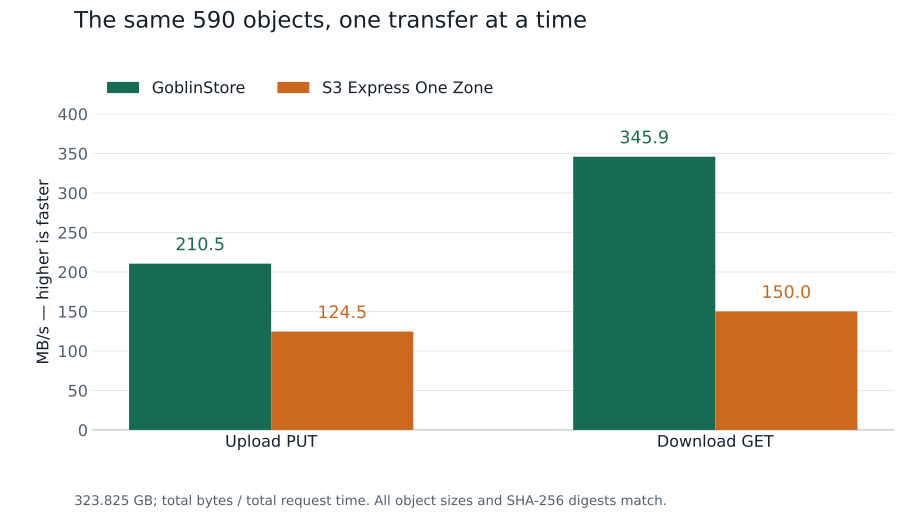
The test dataset was Google's February 2020 English 2-gram corpus, in its original compressed form. Both services transferred the complete corpus: 589 gzip shards and one small counts file, totaling 323,824,707,848 bytes, or 323.825 GB.
All 590 object sizes and recorded upload SHA-256 digests match across services. Every S3 download passed SHA-256 verification, and the GoblinStore download MD5s match the original upload ETags. The comparison covers the same complete dataset in both directions on both services.
| Measurement, identical 590 objects | GoblinStore | S3 Express One Zone |
|---|---|---|
| Upload throughput | 210.5 MB/s | 124.5 MB/s |
| Download throughput | 345.9 MB/s | 150.0 MB/s |
| Median read TTFB | 2.270 ms | 4.453 ms |
| 95th-percentile read TTFB | 2.579 ms | 5.431 ms |
| Median PUT first-response time | 2.622 s | 4.447 s |
Throughput here means total bytes divided by total measured transfer time. MB and GB are decimal units; memory sizes marked MiB or GiB are binary. Percentiles are calculated per request, with the nearest-rank rule for the 95th percentile. All 590 transfers in each phase succeeded, and every download passed its checksum. The S3 run also deleted all 590 test objects, with no retries or errors.
The full S3 run reproduced the earlier 50-object throughput: 124.54 versus 124.47 MB/s for uploads, and 150.04 versus 150.03 MB/s for downloads. Restricting both S3 recordings to the same 50 objects, each transfer rate differed by less than 0.02%. Extending the test to the full corpus left the S3 throughput result unchanged at the precision reported here.
For AWS I chose S3 Express One Zone, its low-latency, single-Availability-Zone storage class, using a directory bucket. The bucket and all EC2 clients were in us-east-2, AZ ID use2-az1. AWS recommends placing the compute and directory bucket in the same AZ; that is how this test was arranged.
Each EC2 client was a c8gn.xlarge, with four Graviton4 vCPUs, 8 GiB RAM, and an ENA network interface. AWS's instance specifications list 12.5 Gbit/s baseline network bandwidth and 40 Gbit/s burst bandwidth for that type. Those are instance specifications, not a promise that one S3 request will run at 40 Gbit/s. AWS separately documents an ordinary 5 Gbit/s single-flow limit outside a cluster placement group, with documented ways to raise it.
The full S3 run was recorded on September 26, 2026, using another Graviton4 c8gn.xlarge in the bucket's AZ. It used the same benchmark source, libcurl version, TLS library, and serial transfer method as the 50-object run.
Two other c8gn.xlarge instances in the same AZ supplied the limited iperf3 3.20 check: one TCP stream for ten seconds in each direction, sequentially.
| Private EC2 path | Receiver throughput | Retransmissions |
|---|---|---|
| Client A → client B | 4.9646 Gbit/s | 0 |
| Client B → client A | 4.9650 Gbit/s | 0 |
The ENA bandwidth, packet-rate, connection-tracking, and link-local allowance-exceeded counters remained zero on both instances. The hosts could move about 621 MB/s on one TCP stream during those checks. A general 1 Gbit/s instance cap does not explain the observed S3 upload rate.
iperf measures TCP, so it does not identify a limiter inside an HTTPS client or S3. I also did not establish whether the S3 route used a VPC gateway endpoint or an Internet gateway; the instance role did not allow route-table inspection. The result I can support is the throughput delivered from colocated EC2 clients to this directory bucket. The network path between those AWS services is part of that delivered result.
The GoblinStore client was a workstation with an AMD Ryzen Threadripper PRO 5995WX: 64 physical cores, 128 hardware threads, 1 TiB RAM, and a 10 GbE connection. The benchmark used one client worker. The service name resolved to the server's LAN address on that client, with the HTTPS certificate name and TLS verification preserved.
The server was a Dell PowerEdge R820 with four Xeon E5-4657L v2 processors, totaling 48 physical cores, 96 hardware threads, and 512 GiB installed RAM. These are the variants with more cores and lower clock speeds: 12 cores per socket, 2.40 GHz base, and up to 2.90 GHz turbo, as listed in Intel's specifications.
I confined GoblinStore to NUMA leaf 1 (Linux node 1) using CPU affinity and memory binding. That is one of the machine's four NUMA leaves, with 12 physical cores and their 24 hardware threads available, 12 server workers, and a 112 GiB locked memory arena on the same leaf.
| Component | NUMA leaf | Attachment |
|---|---|---|
| GoblinStore workers and memory | 1 | CPU affinity and memory binding |
| PERC H710 and its SAS RAID6 array | 0 | PCI 0000:02:00.0 |
Benchmark-facing 10 GbE port, eno1 |
0 | PCI 0000:01:00.0 |
Second 10 GbE port, eno2 |
0 | PCI 0000:01:00.1 |
The R820 also serves other live workloads. Leaf 1 is GoblinStore's allocation on that shared machine; the disk controller and Ethernet ports attach to leaf 0, so GoblinStore's disk and network I/O cross the socket interconnect.
A 30-second background sample at 22:30 UTC on September 25 ended with load averages of 2.14, 2.38, and 2.43 over one, five, and fifteen minutes. The benchmark-facing port averaged approximately 1.0 Mbit/s received and 0.05 Mbit/s transmitted; receive traffic ranged from 0.90 to 1.11 Mbit/s across the three ten-second intervals. The second 10 GbE port had no traffic during that sample. These are current background measurements, taken separately from the benchmark runs.
nginx terminated HTTPS, with request buffering, response buffering, and proxy caching disabled. The completed read run used a 64 KiB proxy buffer.
These are older Ivy Bridge-era Xeons. The observed CPU flags include AES-NI and AVX, but no SHA extensions. Intel lists AVX and AES-NI for this processor. SHA-256 and MD5 hashing run in software through OpenSSL, without dedicated hash offload. AES acceleration for TLS is a separate capability; it does not make these SHA-accelerated processors.
Storage was a single RAID6 array of sixteen 300 GB, 15,000 RPM, 2.5-inch SAS hard drives, behind a Dell PERC H710 with 64 KiB strips. The array exposed 4.192 TB of capacity, with XFS on LVM. All sixteen drives negotiated 6 Gbit/s SAS links. The installed mix was:
| Drive model | Count |
|---|---|
Seagate ST300MP0026 |
2 |
Seagate ST300MP0005 |
5 |
Seagate ST9300653SS |
1 |
HGST HUC156030CSS204 |
2 |
Toshiba AL13SXB30EN |
6 |
All five models are listed as 15K SAS drives in Dell's drive specifications.
The H710 has 512 MB of DDR3 cache with battery and flash protection: on power loss, the battery powers a transfer of cached data to nonvolatile flash, as described in Dell's controller manual. The controller reported 382 MB of firmware cache, with its backup battery in the Optimal state. WriteBack was enabled; individual drive write caches were disabled.
The 323.825 GB workload matters here. It is more than 600 times the controller's onboard memory. The controller cannot explain the entire run by accepting a few hundred gigabytes and keeping them in its 512 MB cache. Sustained writes require it to drain data to the disks. Write-back still affects when a request can be acknowledged; this benchmark does not establish power-loss durability or the exact instant each byte reaches a platter.
I designed GoblinStore to serve object heads from RAM and use O_DIRECT for disk-backed tails. Direct I/O bypasses Linux's page cache; the backing disks and controller cache remain in the read path.
For this benchmark, the RAM head was configured at 1 MiB per object. Across the corpus, those heads amount to roughly 589 MiB plus the small counts object. The 112 GiB arena provides the allocation capacity; the remainder of each large object comes from its disk-backed tail.
The RAM heads reduce first-byte latency. The throughput measurement covers complete objects, including their disk-backed tails.
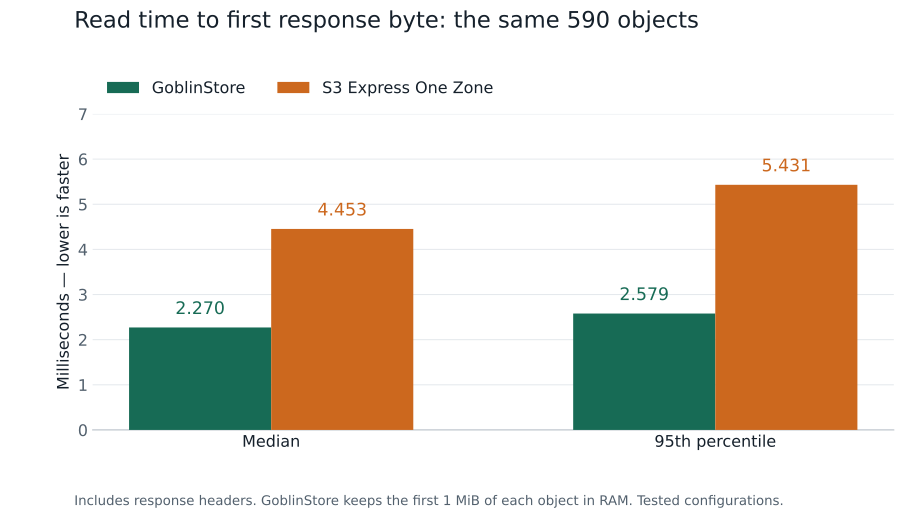
All the clients use libcurl 8.22.0 and OpenSSL 3.5.5, with HTTP/1.1 observed in the recordings. They take transfer times from libcurl's native counters. The TTFB counter measures the first received response byte, including response headers and connection setup when necessary. It is not specifically the first payload byte.
For a PUT, that first response normally follows the upload of the object. The 2.622 s versus 4.447 s values in the table therefore include sending the payload. They are useful request-response measurements, but should not be read as storage lookup latency. GET TTFB is the millisecond-scale measurement plotted above.
The GoblinStore run used separate upload and download clients with 1 GiB payload buffers. The AWS run used the all-in-one client with a pre-touched 2 GiB buffer, uploading one complete object at a time. After all 590 uploads, it performed one S3 GET, verification, and deletion at a time. There was no multipart upload, parallel range read, or concurrent payload transfer.
Payload preparation and upload hashing finish before the PUT timer. Download hashing follows the GET timer. CSV writes, deletion, and S3 Express session refresh are outside the corresponding payload-transfer measurements. TLS, request signing, and client memory-copy costs remain inside. Both clients allow connection reuse; the CSVs record actual new connections, including 345 across the 590 S3 PUTs and ten for its GET phase, versus one in each complete GoblinStore phase.
AWS recommends concurrent connections for maximum throughput with large S3 Express objects. This workload deliberately asks what one object at a time gets. It is not a stress test. It also does not compare the products' durability guarantees, availability, maximum request rates, or behavior under many simultaneous clients.
GoblinStore throughput under concurrency
The second part of the study looks at total throughput and the speed of each active transfer as concurrency rises on GoblinStore. Reads and writes were tested separately. Each point covers the full 590-object, 323.825 GB corpus, using the latest run in each recording. The plotted series stop at the 12-worker runs.
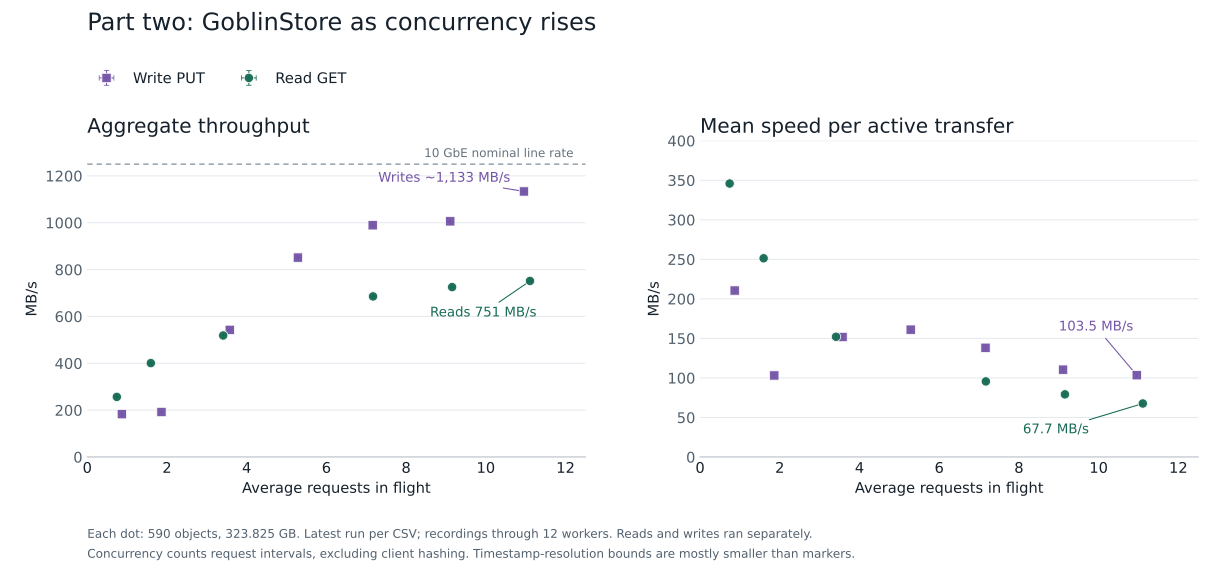
The horizontal axis is average requests in flight, calculated from their start and stop times. For each run, I sum the request durations and divide by the elapsed span from the first request's start to the last request's completion. That is the time average of the number of outstanding requests. A worker loading a file or hashing a response contributes no active request. Idle gaps within the elapsed span remain in the denominator, which is why a one-worker run can average less than one request in flight.
Total throughput is total bytes divided by that same elapsed span. Mean throughput per active transfer is total bytes divided by summed request duration. This measures how much bandwidth each outstanding transfer receives; the physical network connection remains 10 GbE. Client-side gaps reduce the aggregate rate here, while the request-only rates in the first part exclude those gaps.
The concurrent upload recordings have explicit start and stop timestamps with microsecond precision. Downloads and the original single-worker upload have whole-second start times, so their end times are reconstructed by adding libcurl's request durations. Their average concurrency and aggregate throughput are estimates; the timestamp resolution contributes less than 0.25% uncertainty in these run spans. Hashing time is excluded from every request interval.
Across the plotted upload endpoints, average concurrency rises from 0.87 to 10.96 and total throughput rises from 182.8 to 1,133.5 MB/s, or 9.07 Gbit/s at the upper end. Mean throughput per active upload falls from 210.5 to 103.5 MB/s.
For reads, average concurrency rises from 0.74 to 11.11, total throughput rises from 256.5 to 751.5 MB/s, or 6.01 Gbit/s, and mean throughput per active download falls from 345.9 to 67.7 MB/s. More objects in flight make better use of the server's total capacity while each transfer gets a smaller share. These are separate operating points from a shared server; the recordings do not isolate concurrency from changes in background load or configuration.
The concurrency supplement includes the raw recordings, run-selection rules, calculations, and both plots, with a separate SHA-256 checksum.
Client capacity with local nginx
This control measures the client's transfer capacity against a RAM-backed nginx endpoint on the same machine. It establishes CPU and software headroom for the storage comparison. These are local nginx transfer rates, not measurements of S3 performance.
The control used the Threadripper PRO 5995WX workstation and the Graviton4 c8gn.xlarge instance used for the full S3 run. Each machine ran its own nginx 1.28.3 endpoint over loopback, with the client and nginx pinned to separate physical cores. The object and nginx's upload temporary files lived in RAM on tmpfs. These transfers stayed within each machine's local network stack.
Each protocol used one 512 MiB object at a time, with one warm-up PUT/GET pair followed by five measured pairs. The control reused the all-in-one benchmark's transfer code, including its memory-copy callbacks and request signing, with libcurl 8.22.0 and OpenSSL 3.5.5. HTTPS used TLS 1.3 with AES-256-GCM, with certificate verification enabled. Every download passed SHA-256 verification.
| Client CPU | Protocol | PUT to nginx, MB/s | Client CPU, PUT | GET from nginx, MB/s | Client CPU, GET |
|---|---|---|---|---|---|
| Threadripper PRO 5995WX | HTTP | 1,757.6 | 71.1% | 5,316.2 | 99.4% |
| Threadripper PRO 5995WX | HTTPS | 1,136.6 | 76.5% | 1,028.9 | 92.0% |
Graviton4 (c8gn.xlarge) |
HTTP | 3,074.7 | 42.8% | 9,597.4 | 99.1% |
Graviton4 (c8gn.xlarge) |
HTTPS | 1,680.8 | 63.0% | 1,490.5 | 81.1% |
CPU percentages refer to one client core and cover only the timed transfer. Payload preparation, checksum verification, and CSV output are outside that interval. Throughput is total bytes divided by summed transfer time across the five measured requests; CPU usage is summed client thread CPU time divided by the summed elapsed time around those same transfers.
Against local nginx, the Graviton4 client's HTTPS upload and download rates were 13.5× and 9.9× the rates measured against S3 Express. The Threadripper's HTTPS rates were 5.4× the upload rate and 3.0× the download rate in the full-corpus GoblinStore comparison. During the HTTPS controls, nginx consumed 97.5–99.9% of its own core. Both client configurations demonstrated transfer capacity well above what the storage measurements required.
The client headroom supplement contains the control source, nginx setup, build and run instructions, raw transfer and CPU measurements, and calculations, with a separate SHA-256 checksum.
The full-corpus reproduction archive contains the C++ clients, the S3 Express session helper, the exact curl source release, build and run instructions, recorded CSVs, a manifest of all 590 objects, hardware and configuration details, and scripts that regenerate the tables and figures. There is a separate SHA-256 checksum file. The archive contains benchmark-client code; access to the measured GoblinStore service is available by arrangement through the contact information on this site. Reproducing the LAN measurement requires arranging an equivalent LAN path, not measuring an unrelated Internet route.
AWS Service Terms §1.8 permits benchmarking with replication information included in the disclosure and disclosed to AWS, and allows AWS to benchmark and publish results about the customer's products or services. Amazon is welcome to benchmark GoblinStore and publish what it finds. The source, input manifest, measurements, and arithmetic are available for that purpose.