September 2, 2026
Faster isn't better
Faster network paths reduced packet latency but worsened OpenNTPD's steady-state jitter; userspace UDP produced 10.8 times the 10 GbE baseline in this run.
Abstract
This project tests whether kernel-bypass datacenter networking can make the system clock disciplined by OpenNTPD more stable. I added two transport backends beneath the shared Network Time Protocol (NTP) implementation: wire-compatible userspace Ethernet, Internet Protocol version 4 (IPv4), and User Datagram Protocol (UDP) over a ConnectX-5 adapter, and native remote direct memory access (RDMA) using InfiniBand unreliable datagrams (UD). I compared them with kernel UDP over 10 and 100 Gigabit Ethernet (GbE) on the same two servers. The suite ran 10 test families, 372 conditions, and three randomized complete repetitions while preserving the same NTP packet processing, filtering, peer selection, and clock-control code.
The new backends worked, but the performance hypothesis failed. Median steady-state peer jitter—the root-mean-square variation among accepted clock-offset samples in OpenNTPD's eight-sample filter window—was 183.4 microseconds for 10 GbE kernel UDP, 429.7 microseconds for 100 GbE kernel UDP, 1,985.6 microseconds for userspace UDP, and 205.6 microseconds for InfiniBand UD. Every nominally faster path therefore worsened jitter in this run. Userspace UDP reduced idle median round-trip time (RTT) from 369.1 to 202.9 microseconds on the same 100 GbE adapter, but raised jitter to 10.8 times the 10 GbE baseline. The suite also showed that directional queueing biases NTP's offset estimate and found that the RDMA UD client did not rediscover the server after its process restarted. The cause of the jitter regression and automatic RDMA endpoint rediscovery remain under investigation. Because the experiment had no external time reference, these results describe relative synchronization stability, not absolute Coordinated Universal Time accuracy.
I connected the same two Dell PowerEdge R820 servers four different ways to measure how the packet path affects OpenNTPD sampling and synchronization.
Each server has four Intel Xeon E5-4657L v2 processors: 48 physical cores and 96 hardware threads per machine. One server remained the reference; the other was the client whose clock I measured and, during synchronization tests, disciplined. Those roles and physical endpoints never changed.
The paths were:
- normal kernel User Datagram Protocol (UDP) over a 10 GbE Broadcom interface;
- normal kernel UDP over a 100 GbE ConnectX-5 interface;
- userspace Ethernet, Internet Protocol version 4 (IPv4), and UDP over that same ConnectX-5, using a raw-packet verbs queue pair (QP) rather than the kernel UDP data path;
- remote direct memory access (RDMA) using InfiniBand unreliable datagrams (UD) over a 40 Gb adapter.
The Network Time Protocol (NTP) implementation did not change between paths. I gave OpenNTPD one transport interface and kept its packet parsing, filtering, peer selection, and clock control shared.
Round-trip time (RTT) is not the outcome this project is trying to optimize. NTP users do not consume faster request completions. They consume the resulting time base: the system clock that OpenNTPD disciplines. The relevant outcome is therefore the stability of that time base. In this experiment, OpenNTPD's peer jitter measures that stability.
Peer jitter is the root-mean-square variation among the surviving clock-offset samples in OpenNTPD's current eight-sample filter window, measured relative to the lowest-delay sample. Lower jitter means that the daemon is feeding its clock-control loop a more consistent estimate of the clock difference. RTT is still useful diagnostic evidence because variable or asymmetric delay can disturb those offset samples, but lower RTT is not itself a better clock. Without an external time reference, peer jitter measures synchronization consistency rather than absolute Coordinated Universal Time (UTC) accuracy.
The backends worked, but my performance hypothesis failed. Every nominally faster path worsened steady-state peer jitter relative to kernel UDP over 10 GbE in this run. Userspace UDP cut idle RTT substantially, yet increased peer jitter to 10.8 times the 10 GbE baseline.
The complete study, figures, and compact evidence bundle are in the OpenNTPD repository's HTML study package. The modified source is on the dedicated patch branch.
Four transports, one implementation
The kernel UDP cases use the same backend. Binding the source address and interface determines whether traffic crosses the 10 or 100 GbE path.
The two userspace paths use libibverbs, the Linux API for submitting work
directly to RDMA-capable network adapters. The userspace UDP backend is not a
socket with unusual flags. It constructs
normal Ethernet, IPv4, UDP, and NTP packets in registered memory, sends them
through a ConnectX-5 raw-packet queue pair, installs a receive flow, polls
completion queues, validates checksums and addressing, and replenishes receive
work requests. On the wire, it is still UDP.
The InfiniBand backend uses unreliable datagrams. It creates its protection domain (PD), memory regions (MRs), completion queues (CQs), unreliable-datagram queue pair, address handle (AH), and posted receive pool through libibverbs. It does not turn packet loss into a reliable byte stream or substitute a reliable-connection (RC) queue pair for the required UD semantics.
The 40 Gb InfiniBand path uses Mellanox MT27600 Connect-IB adapters.
What the timestamps mean
Every path uses software CLOCK_REALTIME timestamps at equivalent boundaries:
- T1 immediately before the client submits a request;
- T2 immediately after the server receives it;
- T3 immediately before the server submits its response;
- T4 immediately after the client receives it.
The standard two-way calculations are:
delay  = (T4 - T1) - (T3 - T2)
offset = ((T2 - T1) + (T3 - T4)) / 2
The second expression is NTP's two-way offset estimator: its estimate of how far the reference clock is ahead of or behind the client clock. When request and response delays are equal, those network delays cancel. When they are unequal, half their difference appears in the estimated clock offset.
No path received hardware timestamps. That would have made this a comparison of timestamp facilities instead of a comparison of software-visible packet paths.
There was also no external timing reference. Each four-timestamp exchange produces one estimate of the relative clock offset between the two machines. While the client runs freely, that offset changes because the two oscillators run at slightly different rates. I model that expected change with the fitted line:
predicted offset(t) = a + b*t
residual(t) = measured offset(t) - predicted offset(t)
The residual is therefore the vertical distance between one measured offset and the fitted drift line at the same time. If the estimator measures +120 microseconds and the line predicts +110 microseconds, the residual is +10 microseconds. A negative residual falls below the line. The absolute residual used in the cumulative distribution function (CDF) ignores that direction and keeps the distance from the line.
Residuals describe short-timescale scatter after removing the modeled clock drift. They are not errors against UTC, and neither the measured offset nor its residual establishes absolute clock accuracy.
The raw format keeps integer nanosecond T1–T4 values and stores twice the offset as an integer, preserving half-nanosecond results. All 11,018 complete exchanges reproduce the recorded delay and offset arithmetic exactly.
The synchronization result: faster paths worsened jitter
After the client settled under OpenNTPD discipline, the median measurements were:
| transport | measured relative offset | filtered offset | peer jitter | sync losses |
|---|---|---|---|---|
udp10 |
+231.5 µs | +260.4 µs | 183.4 µs | 0 |
udp100 |
+5.9 µs | −43.4 µs | 429.7 µs | 0 |
uudp100 |
−1,435.7 µs | −2,478.4 µs | 1,985.6 µs | 0 |
ib40 |
+77.0 µs | +85.6 µs | 205.6 µs | 0 |
The filtered offset is OpenNTPD's selected estimate from its recent sample window. Peer jitter reports how widely the surviving offset samples vary around the lowest-delay sample in that window.
Kernel UDP over 100 GbE had 2.3 times the 10 GbE jitter. Userspace UDP over the same 100 GbE adapter had 10.8 times the 10 GbE jitter. InfiniBand UD was closer, but still 12% higher. No path lost synchronization during the steady-state window. All three nominally faster paths nevertheless worsened the jitter seen by the clock discipline.
The mechanism is not yet known. Polling placement, directional software cost, queue behavior, and short-run host variation are candidates, not conclusions. The next experiment will isolate them with longer runs and per-stage timing. The tested kernel-bypass implementations worsened measured steady-state jitter in this run. The cause remains unresolved.
Idle packet-path latency is supporting evidence
The first test left the client free-running. For each transport and repetition I fit:
offset(t) = a + b*t
and analyzed the residual after removing the fitted drift.
| transport | median RTT | p99 RTT | RMS residual | p99.9 absolute residual |
|---|---|---|---|---|
udp10 |
388.6 µs | 418.6 µs | 14.6 µs | 41.8 µs |
udp100 |
369.1 µs | 392.0 µs | 11.5 µs | 29.7 µs |
uudp100 |
202.9 µs | 261.9 µs | 13.9 µs | 28.6 µs |
ib40 |
253.5 µs | 276.8 µs | 11.1 µs | 39.4 µs |
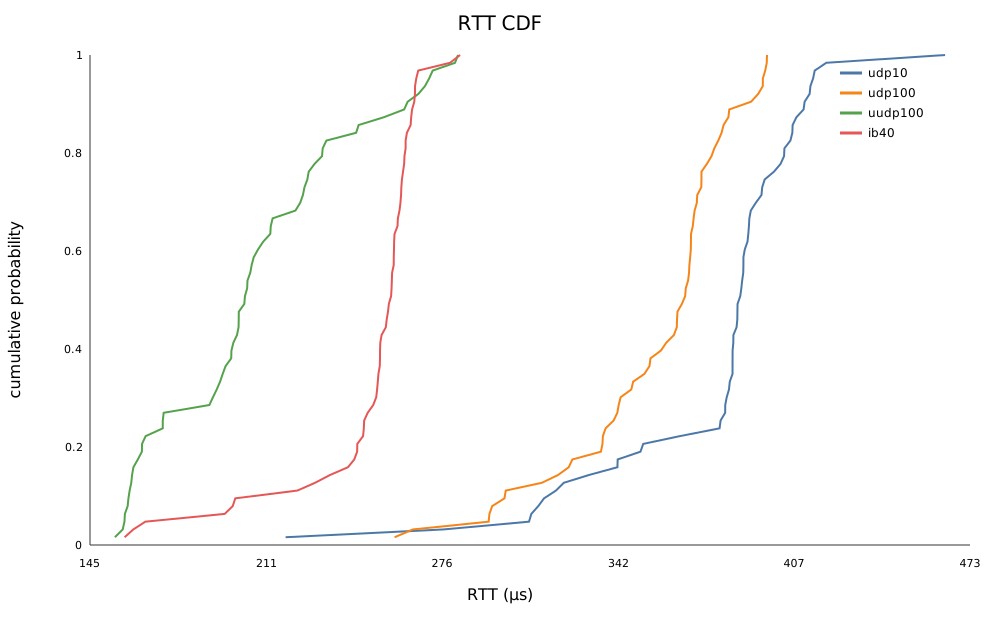
Moving kernel UDP from 10 to 100 GbE reduced the median by about 19.5 microseconds, or 5%.
Bypassing the kernel UDP data path on the same 100 GbE adapter reduced it by 166.3 microseconds, or 45%.
This workload sends roughly one NTP request per second. It is nowhere near line-rate limited. The printed bandwidth on the adapter therefore says little about the idle result. Submission, wakeup, polling, completion handling, and scheduler behavior dominate the path seen by the application.
The free-running residuals did not follow the RTT ranking.
RDMA UD had the smallest RMS residual at 11.1 microseconds, narrowly ahead of kernel UDP over 100 GbE at 11.5. Userspace UDP was fastest but its RMS residual was 13.9 microseconds.
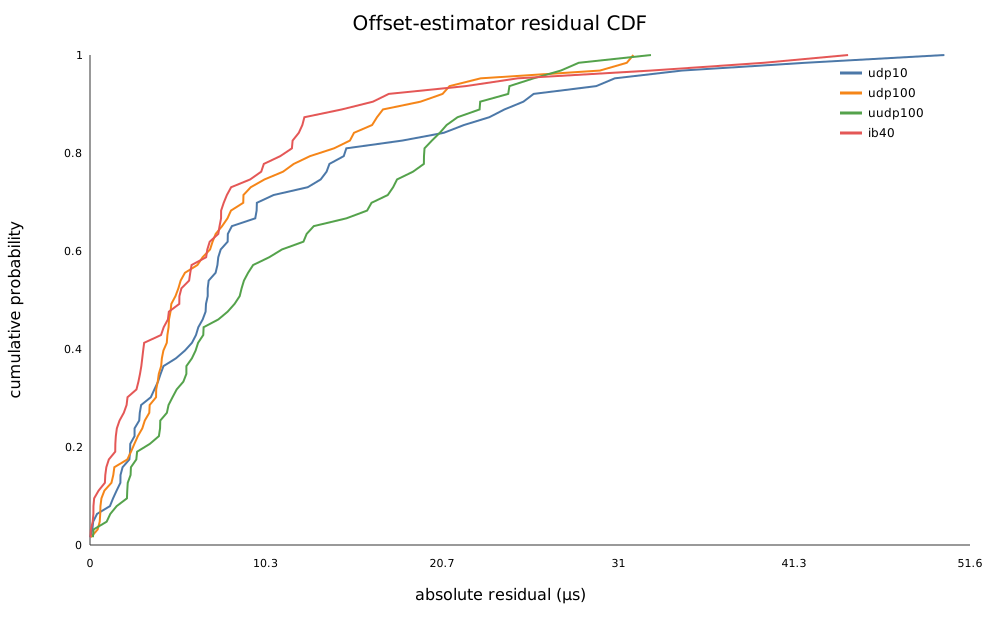
The path with the lowest latency did not have the lowest measurement noise.
Under load, the paths diverged
The table below compares NTP latency while the path was quiet with NTP latency while a separate generator sent large packets in both directions. Before the clock tests, the runner measured the maximum sustained background rate on each physical path. The “90%” condition requested 90% of that measured rate, rather than 90% of the speed printed on the adapter.
Under large-packet bidirectional load:
| transport | baseline median RTT | achieved background load | loaded median RTT | loaded p99 RTT |
|---|---|---|---|---|
udp10 |
388.7 µs | 6.03 Gbit/s | 1,822.8 µs | 3,070.1 µs |
udp100 |
370.7 µs | 75.62 Gbit/s | 372.1 µs | 390.3 µs |
uudp100 |
229.3 µs | 80.21 Gbit/s | 217.0 µs | 280.5 µs |
ib40 |
245.0 µs | 36.75 Gbit/s | 237.5 µs | 271.4 µs |
The 10 GbE path's median grew by 4.7 times and its p99 crossed three milliseconds. Its median sample-rejection rate at that condition was 7.14%.
The three higher-capacity paths stayed close to their unloaded medians. This does not mean congestion cannot hurt them. It means the achieved loads, queueing behavior, and test duration did not produce the same collapse on this hardware.
This latency result is useful because variable queueing can perturb the offset samples from which jitter is calculated. It is not itself the synchronization result.
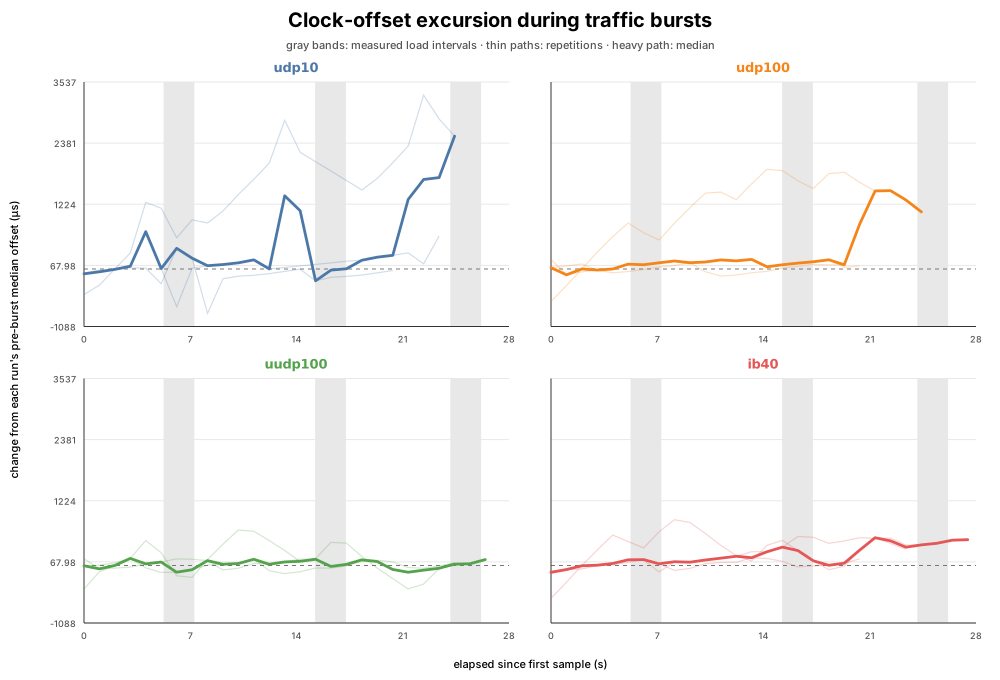
A separate burst test alternated quiet periods with two seconds of bidirectional background traffic. In the figure below, the horizontal axis is time, the vertical axis is the change from each run's quiet pre-burst median offset, and gray bands mark when the load generator was active. Thin paths are individual repetitions; each heavy path is their per-second median. The common vertical scale shows that the 10 GbE excursions were much larger while retaining the smaller changes measured on the other paths.
udp10 reached a 2.80 ms p99 RTT during the bursts. udp100, uudp100,
and ib40 stayed below 406 microseconds.
Directional load moved the apparent clock
Suppose the reference clock is actually ahead of the client by θ. Let
d_request be the request's one-way network delay and d_response the
response's one-way delay. The four NTP timestamps produce:
estimated offset = θ + (d_request - d_response) / 2
NTP cannot distinguish a true clock difference from half the difference between those one-way delays. Equal delays cancel. A queue in only one direction becomes an apparent clock offset. The directional-load test creates that asymmetry deliberately by loading one direction at a time.
On udp10, the median measured offset was:
- +691.0 µs while loading client → reference;
- −229.8 µs while loading reference → client.
That is a 920.8 microsecond directional spread produced without changing either clock.
The corresponding end-to-end spreads were 10.0 microseconds for udp100,
86.5 for uudp100, and 126.3 for ib40. The chart maps
reference-to-client load to −1, bidirectional load to 0, and
client-to-reference load to +1. It shows the repetitions, condition medians,
and a fitted line; the reported slope is the offset change per unit of that
normalized direction. For udp10, the slope magnitude is 460.4 microseconds.
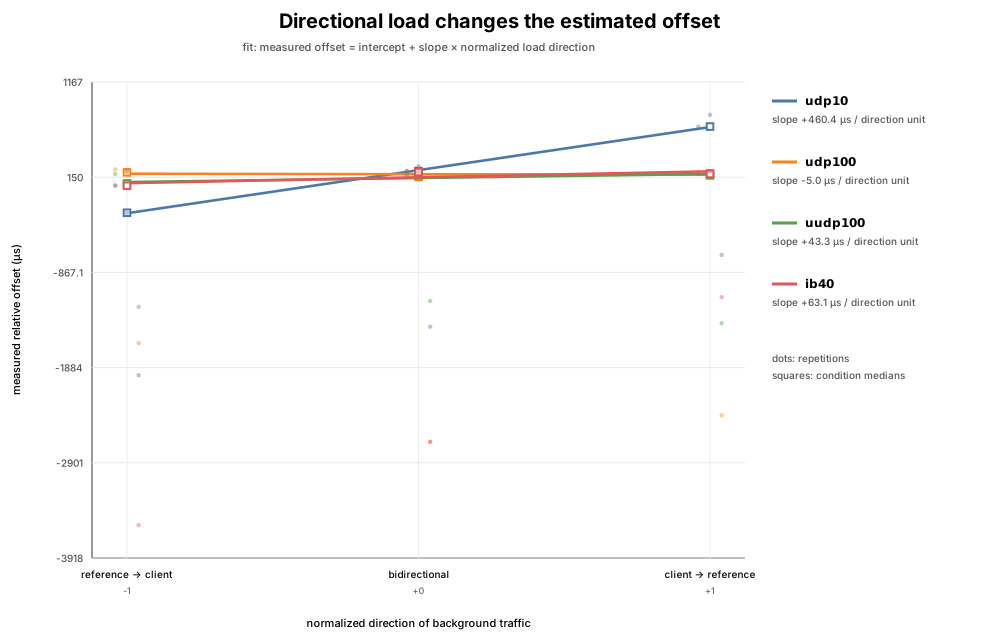
The estimator therefore reports part of the network-delay asymmetry as clock offset.
Recovery results and one backend defect
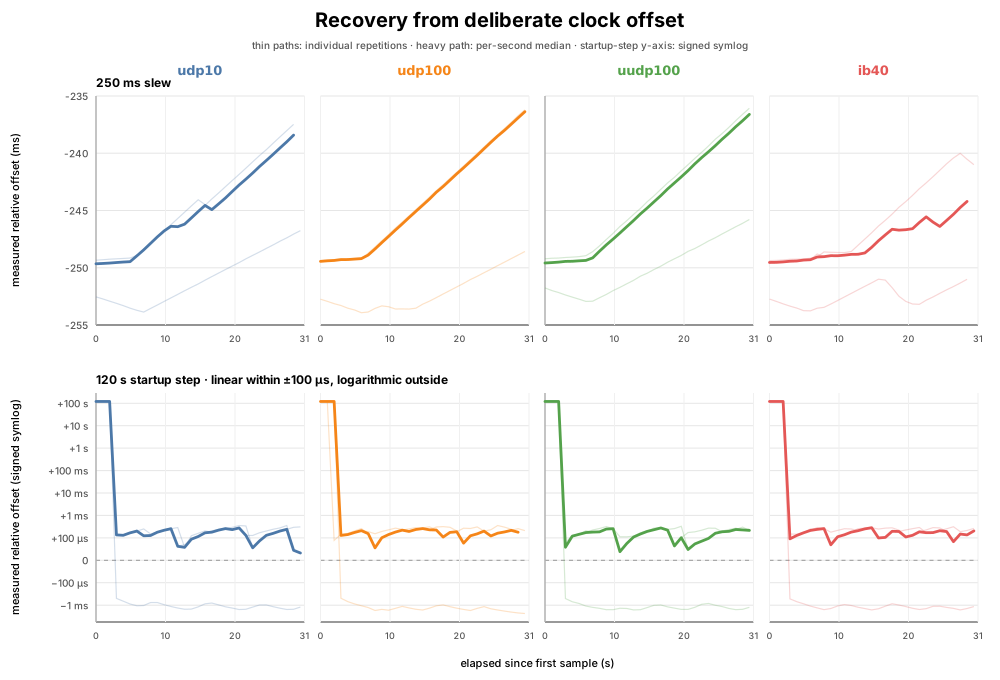
Placing the client 120 seconds behind the reference exercised startup-step behavior. A step is a one-time clock jump; a slew is a gradual correction made by changing the clock's rate. All four transports reached three consecutive accepted samples within 1 ms in 4.24 to 4.30 seconds.
The 120-second starting offset is more than a million times larger than the smallest post-step offsets, so a linear axis hides the behavior near zero. An ordinary logarithmic axis cannot represent zero or negative values. The chart instead uses a signed symmetric-logarithmic, or symlog, axis for the startup step. The central interval from −100 to +100 microseconds is linear. Outside that interval, equal vertical distances represent tenfold changes in magnitude, while the sign is preserved.
At roughly one accepted sample per second, the expanded scale shows no repeated ringing through zero. It cannot resolve faster motion between NTP exchanges. After the step, eight transport/repetition traces stayed positive between +32.5 and +355.1 microseconds. In the third repetition, all four transports crossed zero once and then stayed negative, ranging from −0.492 to −2.360 milliseconds during the remaining window. That is a repetition-dependent post-step bias and drift, not repeated oscillation around zero in the observed samples.
The modest 250 ms slew did not reach that criterion within the 30-second window on any transport. Controlled positive and negative 50 parts-per-million (ppm) frequency errors also did not converge within 30 seconds; the final injected errors remained ±50 ppm on every transport. These conditions measured only the first 30 seconds of OpenNTPD's response, not full control-loop convergence.
Process and connectivity recovery were faster:
- client restart reacquired in a median 0.55–0.64 seconds;
- transport restart reacquired in 0.74–0.77 seconds;
- connectivity restoration reacquired in 1.60–1.89 seconds.
The RDMA UD client did not reacquire after the reference process restarted within the 24-second condition. A restarted UD server has a new QP number; the client retained stale remote addressing and recorded no accepted post-action sample.
The process stayed running, the queue pairs did not wedge, cleanup succeeded, and telemetry recorded no completion-queue failure. Synchronization still did not recover. We are investigating this now. The planned fix will invalidate stale remote addressing when the server endpoint disappears and rediscover the restarted server's new QP number. The same restart condition will then test automatic reacquisition.
Packet-loss results
The experiment injects loss before transport submission so all four backends receive the same semantics. RDMA UD does not retransmit injected drops; they remain lost datagrams.
At a nominal 1% loss setting, the deterministic sixteen-second window produced one dropped request and about a 6.7% observed rejection rate. At 5%, it produced two drops and roughly 6.7–7.1% rejection.
Sixteen samples cannot estimate 0.1% loss; the 0.1% condition often dropped no packet at all. These short conditions exercise behavior consistently, but they are not a statistically powerful packet-loss study.
What failed and what remains unresolved
The run failed its main performance objective:
- All three nominally faster paths worsened steady-state peer jitter relative to 10 GbE. Userspace UDP raised it to 10.8 times the 10 GbE baseline.
- Userspace UDP's steady-state measured and filtered offsets were also much larger in this invocation. The cause has not yet been isolated.
- A 30-second window was too short for the 250 ms slew and ±50 ppm frequency corrections to converge, so those tests do not compare final control-loop accuracy.
- The RDMA UD client did not rediscover the server after a server-process restart. That recovery defect is under active investigation.
The run also showed that directional queueing biases NTP's offset estimate and that the saturated 10 GbE path developed millisecond-scale queueing. RDMA UD had the lowest free-running root-mean-square residual, but that did not turn into the lowest steady-state jitter.
The source, configuration, raw observations, event stream, inventories, randomized order, summary, and plots are available from the study's evidence package.